Identifying individual query waits on SQL Azure Database.
Date created: 7/31/2017.
On this article we are showing three ways to capture waits at the query level on
a SQL Azure Database.
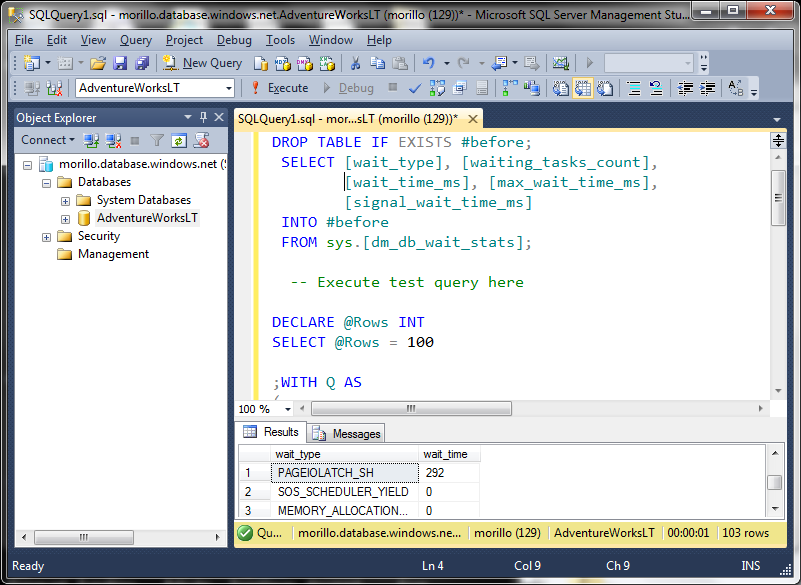
The first way to capture waits at query level was shared with me by Joe Sack
(MSFT). The script relies on temporary tables to show the accumulated waits
during query execution.
DROP TABLE IF EXISTS #before;
SELECT [wait_type], [waiting_tasks_count],
[wait_time_ms], [max_wait_time_ms],
[signal_wait_time_ms]
INTO #before
FROM sys.[dm_db_wait_stats];
-- Execute test query here
DECLARE @Rows INT
SELECT @Rows = 100
;WITH Q AS
(
SELECT A.StateProvince, A.CountryRegion,
ROW_NUMBER() OVER (PARTITION BY A.CountryRegion ORDER BY A.StateProvince,
A.CountryRegion) GrpRow
FROM SalesLT.Address A
)
SELECT TOP(@Rows) Q.*
FROM Q
WHERE GrpRow <= 1 + CEILING(@Rows * 1.0 / ( SELECT COUNT(DISTINCT CountryRegion)
FROM Q))
-- Finish test query
DROP TABLE IF EXISTS #after;
SELECT [wait_type], [waiting_tasks_count], [wait_time_ms], [max_wait_time_ms],
[signal_wait_time_ms]
INTO #after
FROM sys.[dm_db_wait_stats];
-- Show accumulated wait time
SELECT [a].[wait_type], ([a].[wait_time_ms] - [b].[wait_time_ms]) AS [wait_time]
FROM [#after] AS [a]
INNER JOIN [#before] AS [b] ON
[a].[wait_type] = [b].[wait_type]
ORDER BY ([a].[wait_time_ms] - [b].[wait_time_ms]) DESC;
The following image shows the result of above script.
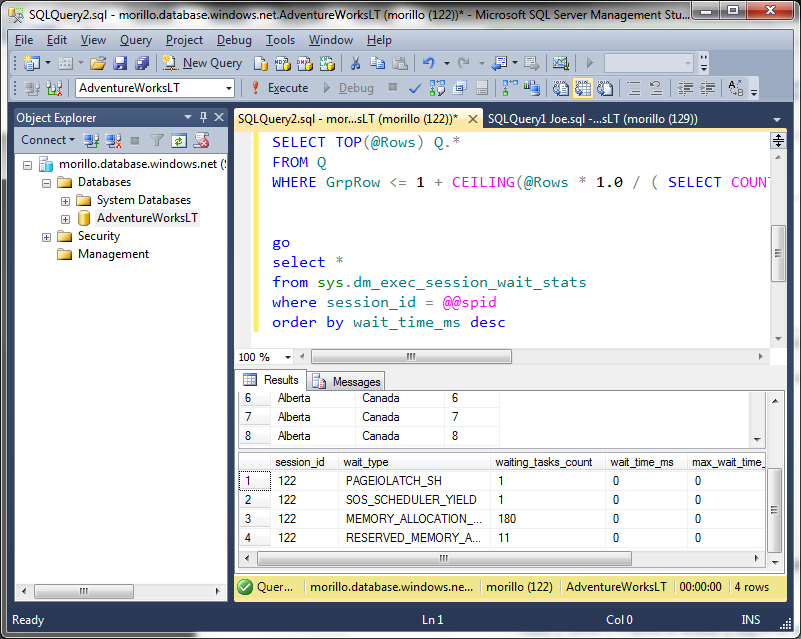
A second way to capture query waits in SQL Azure Database is using the
sys.dm_exec_session_wait_stats dynamic management view.
-- Your query here
GO
SELECT *
FROM sys.dm_exec_session_wait_stats
WHERE session_id = @@spid
ORDER BY wait_time_ms desc
The following image shows how to use sys.dm_exec_session_wait_stats to capture
query waits.
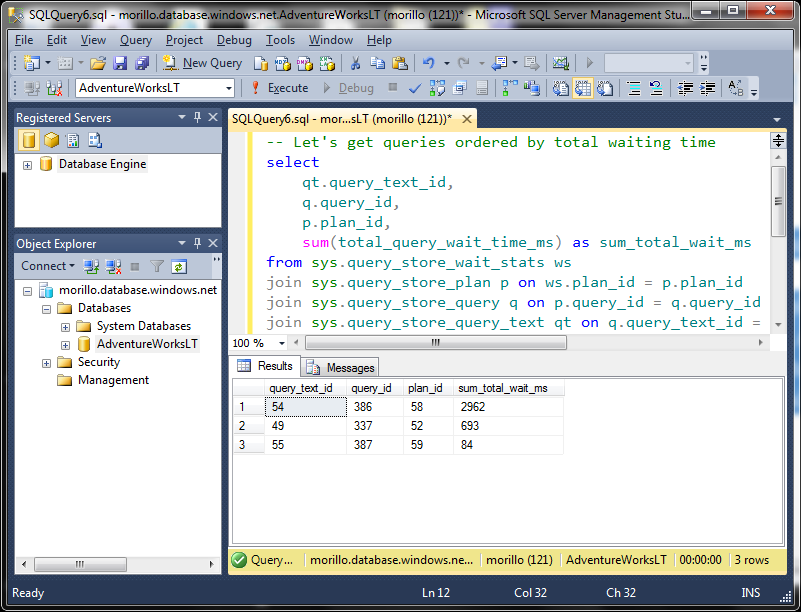
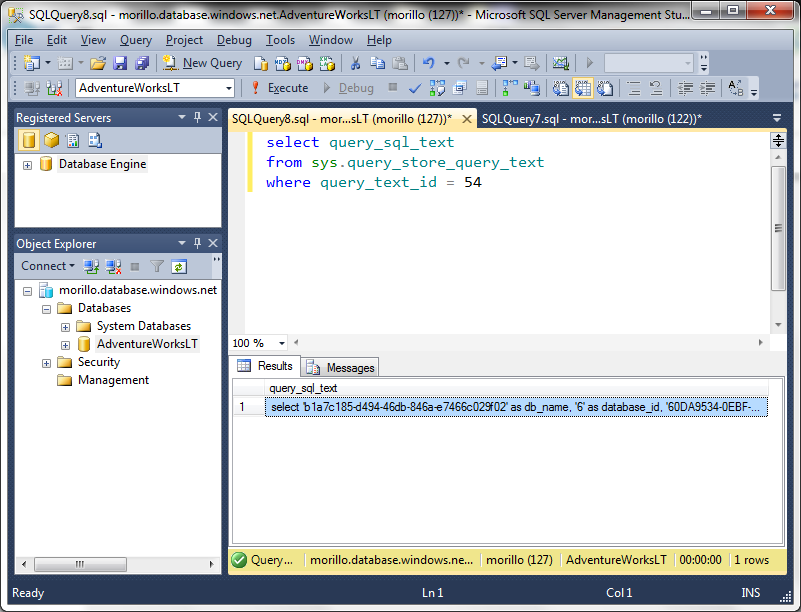
The last way to capture waits for individual queries uses the
query_store_wait_stats
We first identify those queries waiting the most.
select
qt.query_text_id,
q.query_id,
p.plan_id,
sum(total_query_wait_time_ms) as sum_total_wait_ms
from sys.query_store_wait_stats ws
join sys.query_store_plan p on ws.plan_id = p.plan_id
join sys.query_store_query q on p.query_id = q.query_id
join sys.query_store_query_text qt on q.query_text_id = qt.query_text_id
group by qt.query_text_id, q.query_id, p.plan_id
order by sum_total_wait_ms desc
Let's use the plan id to sho the waits related to that plan. For this example,
we are using plan id 58.
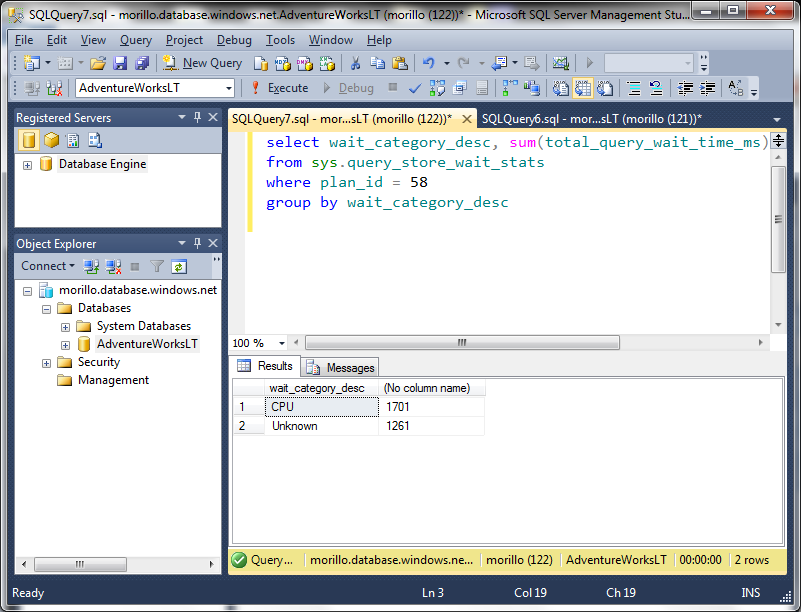
That query plan was waiting for CPU resources.
Let's now identify which query is related to that plan.
![[Company Logo Image]](images/SQLCofee.jpg)