![[Company Logo Image]](images/SQLCofee.jpg)
![]()
![]()
![]()
![]()
![]()
![]()
![]()
![]()

|
|
|
|
Using SQL Azure and Tableau for creating reports.
Date created: 8/19/2017.
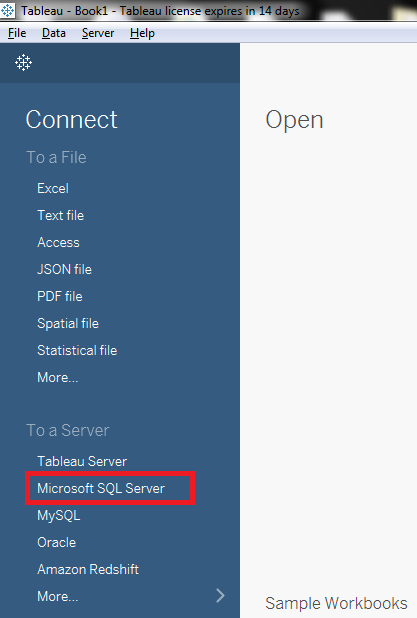
This articles requires to download and install an evaluation of Tableau Desktop Professional Edition. We also need to load the New York Taxi Cab data from Azure BLOB storage wasbs://2013@nytpublic.blob.core.windows.net/ into a SQL Azure database or a SQL Azure Data Warehouse database. Once we have installed the prerequisites and loaded the sample data, let's open Tableau Desktop Professional Edition and then make a click on "Microsoft SQL Server" as shown on below image.
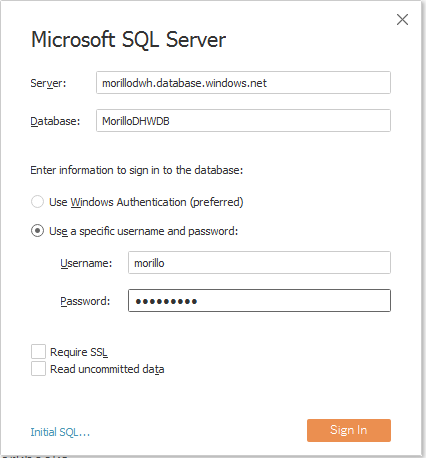
On the next dialog you need to provide the name of SQL Azure Data Warehouse server or the SQL Azure server on the "Server:" field. Next you need to provide the database name on the "Database:" field. Finally you have to provide user credentials and click on the "Sign In" button.
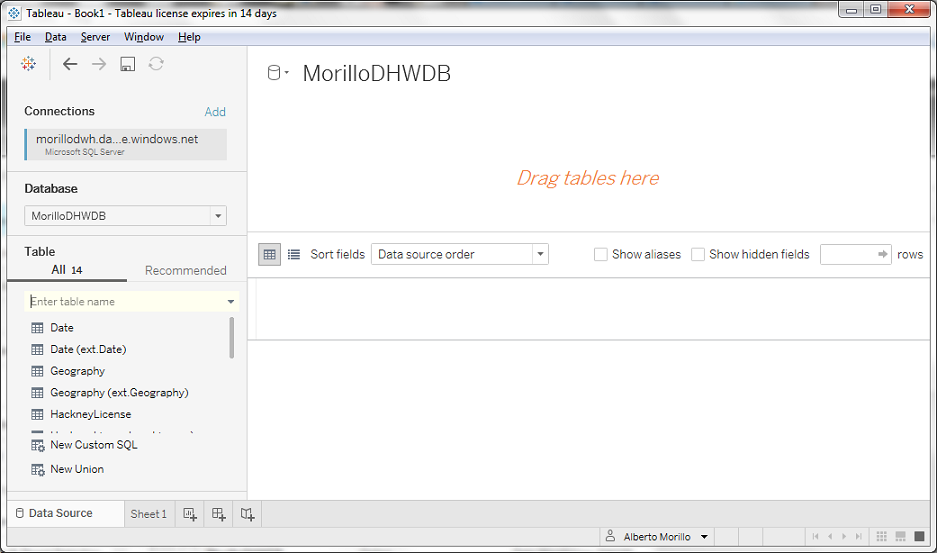
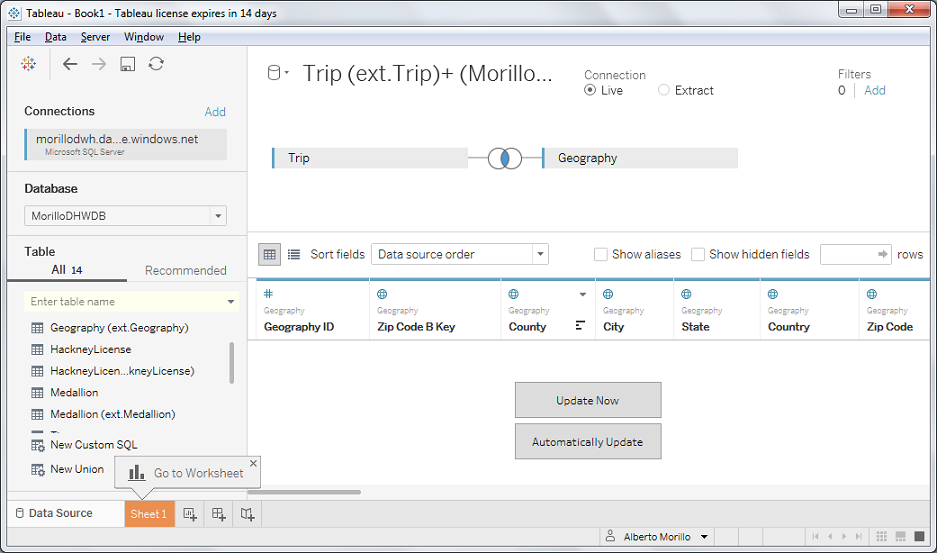
Once authenticated the Data Source screen is shown next, and here we are supposed to drag tables from the left panel to the top of screen, and specify the type of relationship between the tables you have dragged.
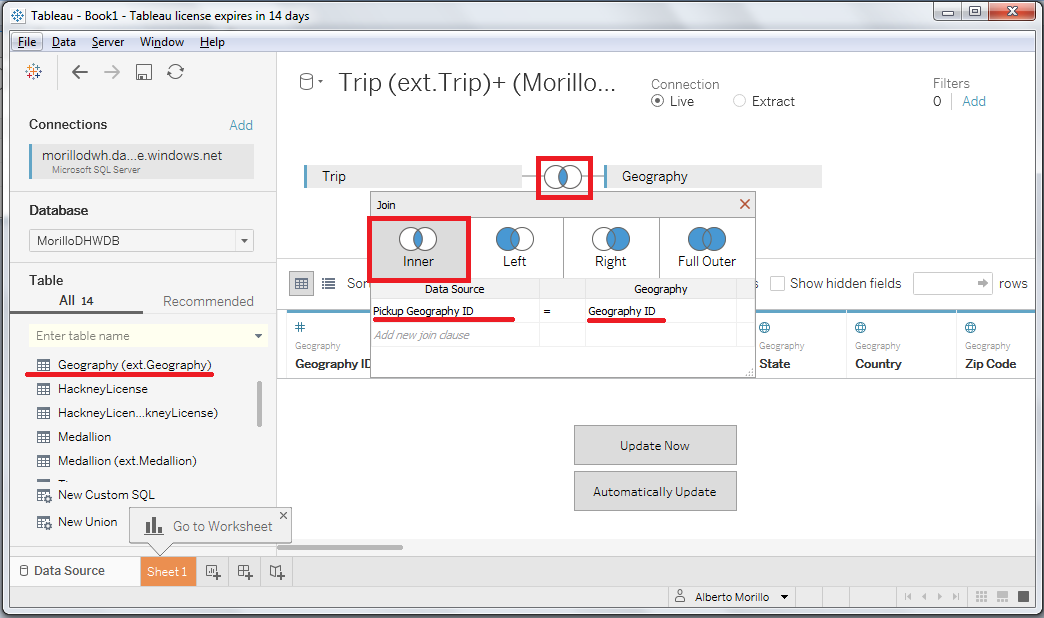
On below image we have dragged to tables "Trip (ext. Trip)" and "Geography (ext. Geography)" and defined an inner join between them. The red square lines specify where you need to make click with the mouse.
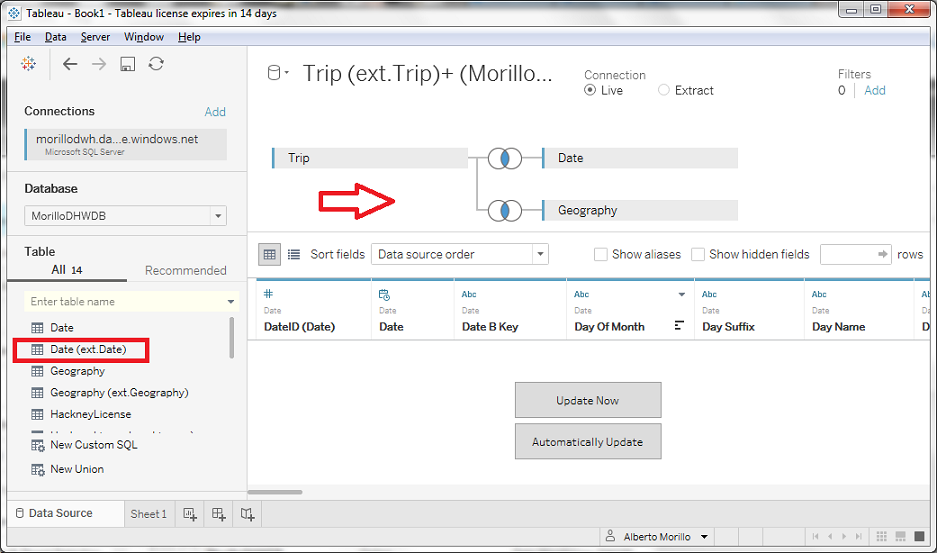
After creating the relationship between both tables the Tableau Desktop screen should look as the following image.
Now we proceed to add the "Date (ext. Date)" table as data source and join the table with the "Trip (ext. Trip)" table. We defined an inner join relationship between both tables.
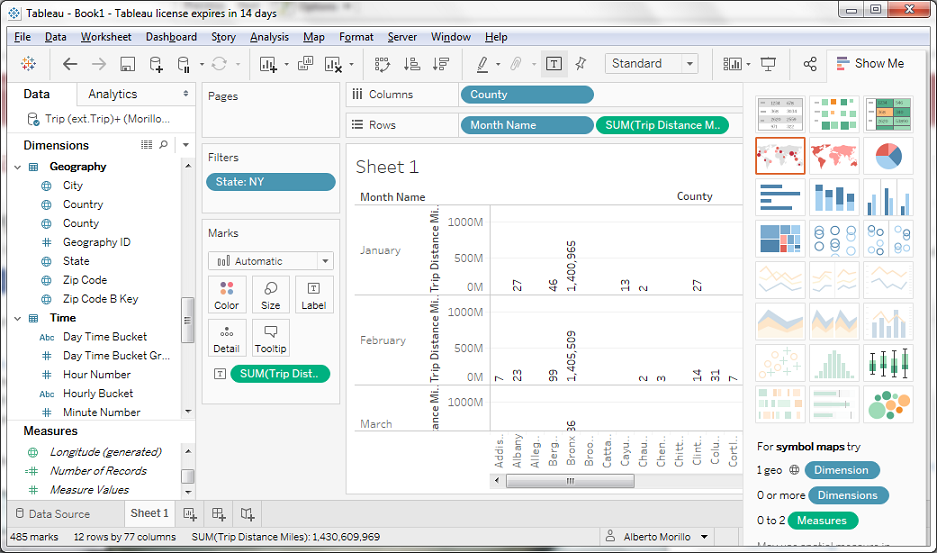
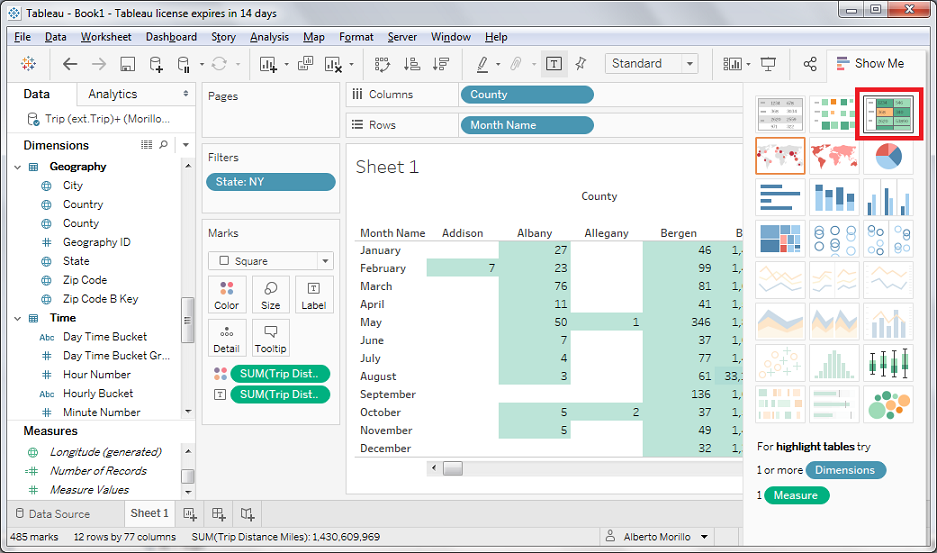
Now, lets make a click on the "Sheet 1" tab at the bottom left side of the screen and start adding the rows and columns that will be part of our reports. As you can see on below image, I added the County attribute on the columns and added "Month Name" and the "Trip Distance" attributes. I also set a filter to show only New York (NY) data.
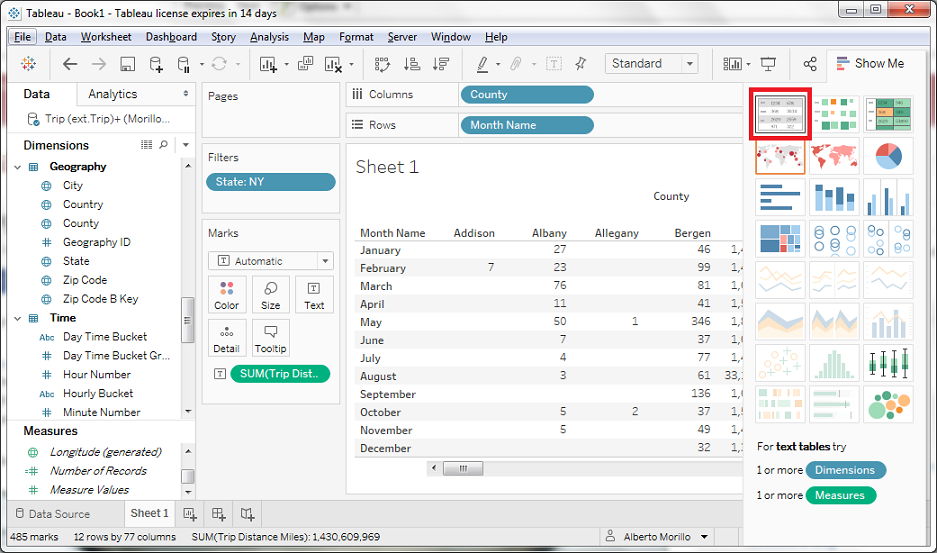
Now we start to choose from the different report options available on Tableau. The red square line shows the report we chose.
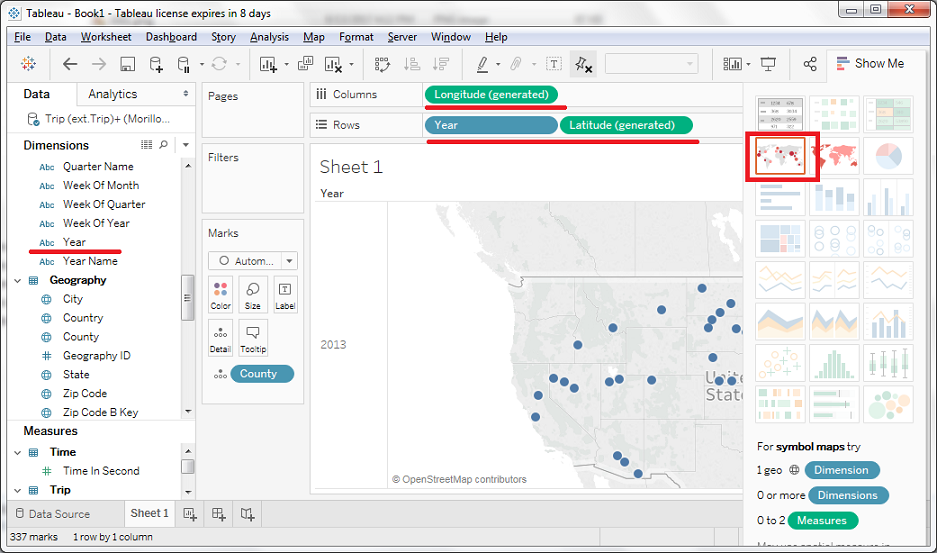
After that we choose a different report option as shown on the next image.
Finally, we wanted to plot geographic data of taxi trips on a map.
|
|
.Send mail to
sqlcoffee.stretch737@simplelogin.com with
questions or comments about this web site.
|