Grouping customers using Azure SQL DB Machine Learning.
Date created: June 2, 2019.
In this article, we will use Azure SQL Database Machine Learning Services to
group customers of an online store using K-means (clustering) based on their
purchase and return history.
We are trying to reproduce an
old SQL Server tutorial on the new Azure SQL Database Machine Learning
service.
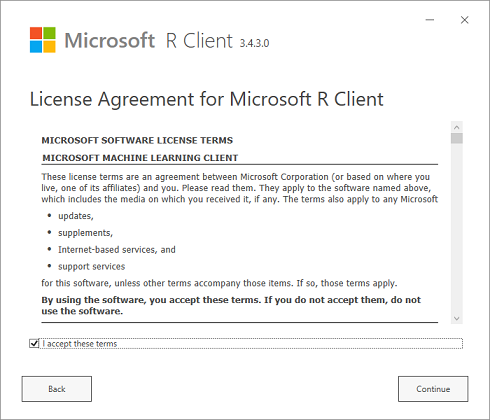
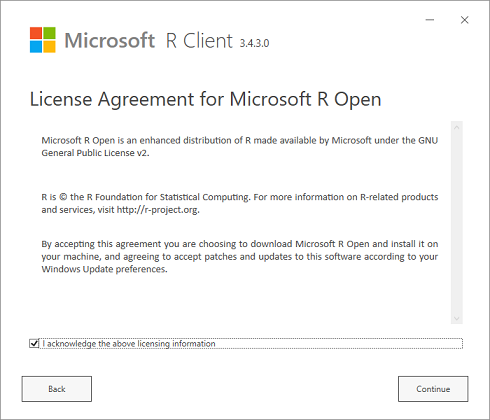
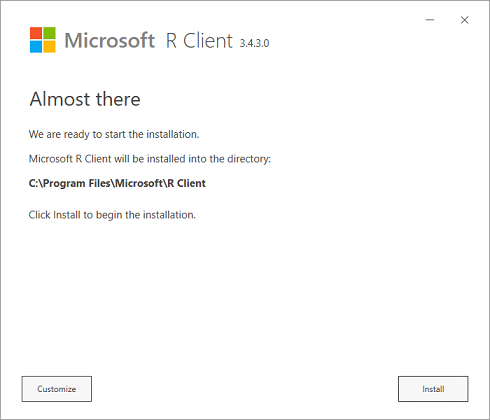
Installing Microsoft R Client and SQL Server Management Studio.
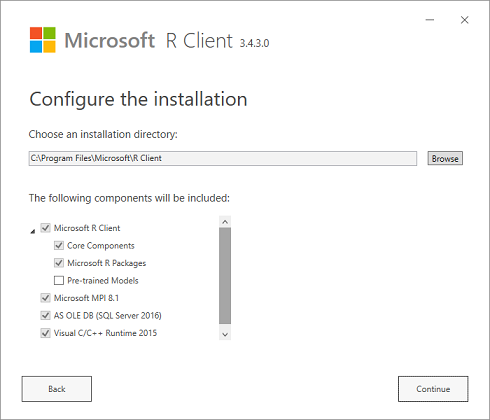
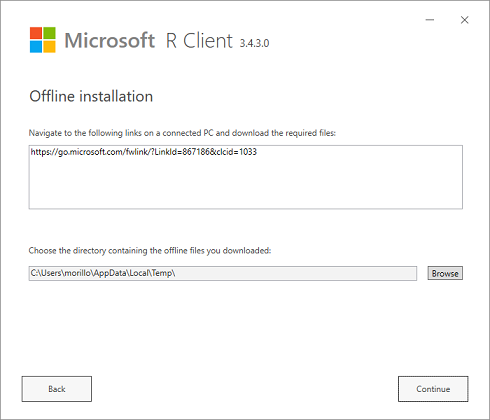
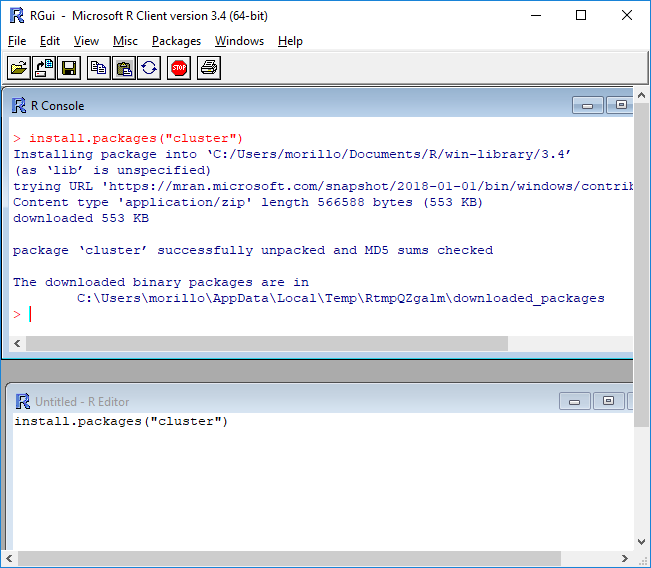
For the purpose of this article we need to install
Microsoft R Client.
We also need to install SQL Server Management Studio as explained
here.
Calculating sales return KPIs.
In this section we are using R Client to connect to an Azure SQL Database and
get some KPIs about sales returns like the return frequency, the return order
ratio, the return item ratio and the return amount ratio.
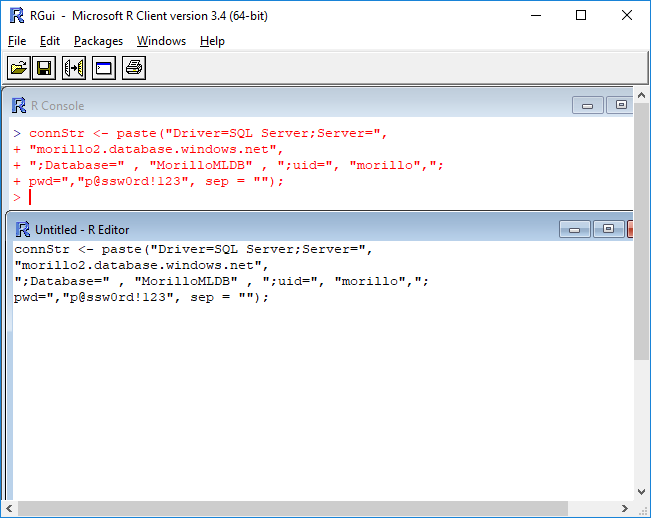
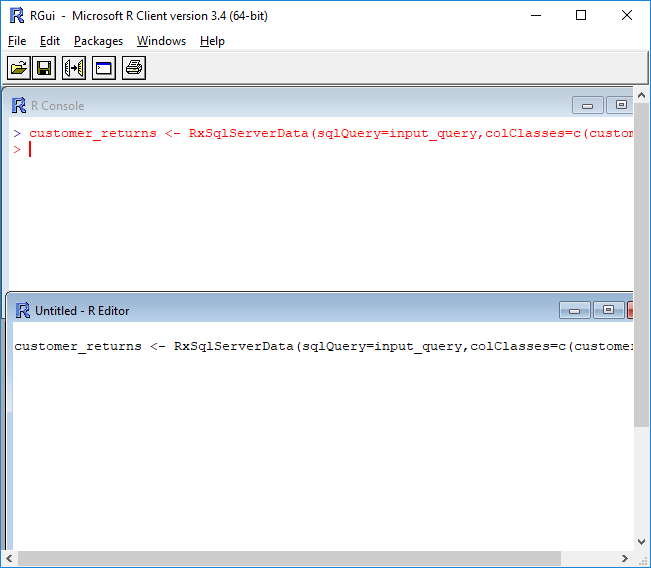
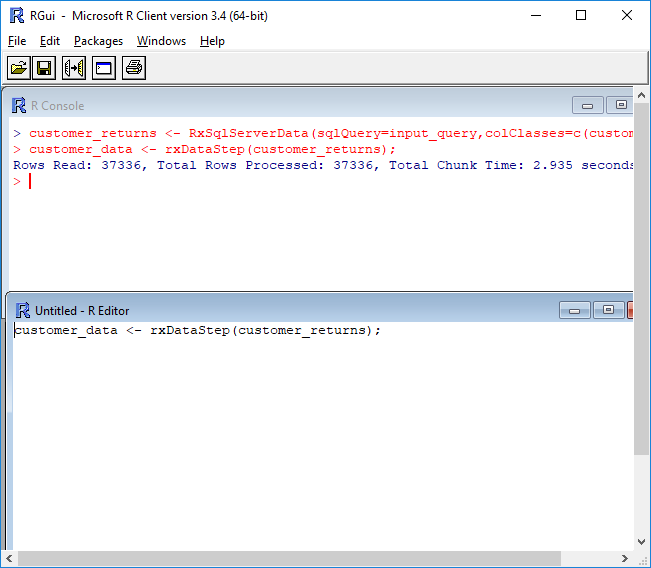
On the next image you see how to connect to an Azure SQL Database using
Microsoft R Client.
Below the query to calculate all required KPIs.
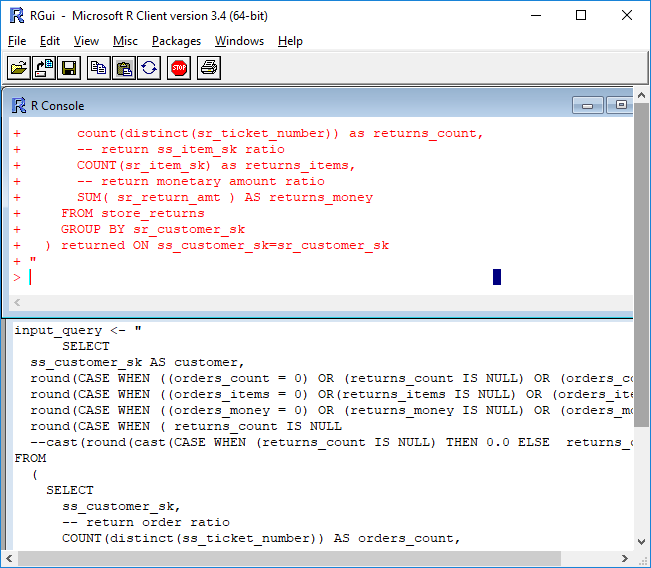
input_query <- "
SELECT
ss_customer_sk AS customer,
round(CASE WHEN ((orders_count = 0) OR (returns_count IS NULL) OR (orders_count
IS NULL) OR ((returns_count / orders_count) IS NULL) ) THEN 0.0 ELSE (cast(returns_count
as nchar(10)) / orders_count) END, 7) AS orderRatio,
round(CASE WHEN ((orders_items = 0) OR(returns_items IS NULL) OR (orders_items
IS NULL) OR ((returns_items / orders_items) IS NULL) ) THEN 0.0 ELSE (cast(returns_items
as nchar(10)) / orders_items) END, 7) AS itemsRatio,
round(CASE WHEN ((orders_money = 0) OR (returns_money IS NULL) OR (orders_money
IS NULL) OR ((returns_money / orders_money) IS NULL) ) THEN 0.0 ELSE (cast(returns_money
as nchar(10)) / orders_money) END, 7) AS monetaryRatio,
round(CASE WHEN ( returns_count IS NULL ) THEN 0.0 ELSE returns_count END, 0) AS
frequency
--cast(round(cast(CASE WHEN (returns_count IS NULL) THEN 0.0 ELSE returns_count
END as double)) as integer) AS frequency
FROM
(
SELECT
ss_customer_sk,
-- return order ratio
COUNT(distinct(ss_ticket_number)) AS orders_count,
-- return ss_item_sk ratio
COUNT(ss_item_sk) AS orders_items,
-- return monetary amount ratio
SUM( ss_net_paid ) AS orders_money
FROM store_sales s
GROUP BY ss_customer_sk
) orders
LEFT OUTER JOIN
(
SELECT
sr_customer_sk,
-- return order ratio
count(distinct(sr_ticket_number)) as returns_count,
-- return ss_item_sk ratio
COUNT(sr_item_sk) as returns_items,
-- return monetary amount ratio
SUM( sr_return_amt ) AS returns_money
FROM store_returns
GROUP BY sr_customer_sk
) returned ON ss_customer_sk=sr_customer_sk
"
customer_returns <- RxSqlServerData(sqlQuery=input_query,colClasses=c(customer
="numeric" , orderRatio="numeric" , itemsRatio="numeric" , monetaryRatio="numeric"
, frequency="numeric" ),connectionString=connStr);
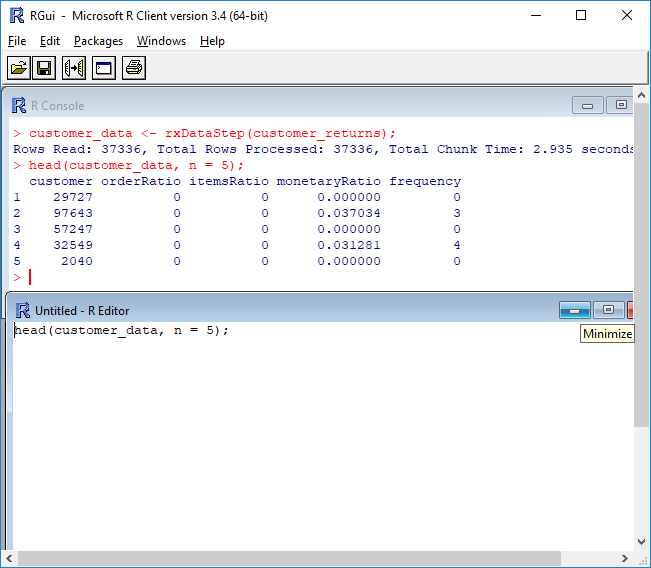
Showing the results for 5 customers only.
Using Kmeans to perform clustering and analyzing results using a Plot.
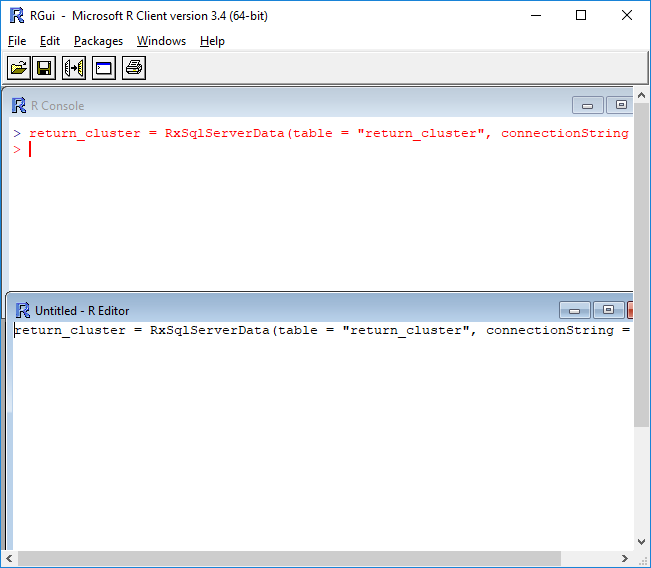
return_cluster is the output table to hold the customer group mappings. This is
a table where the cluster mappings will be saved in the database. This table is
generated from R.
Set.seed for random number generator for predictability.
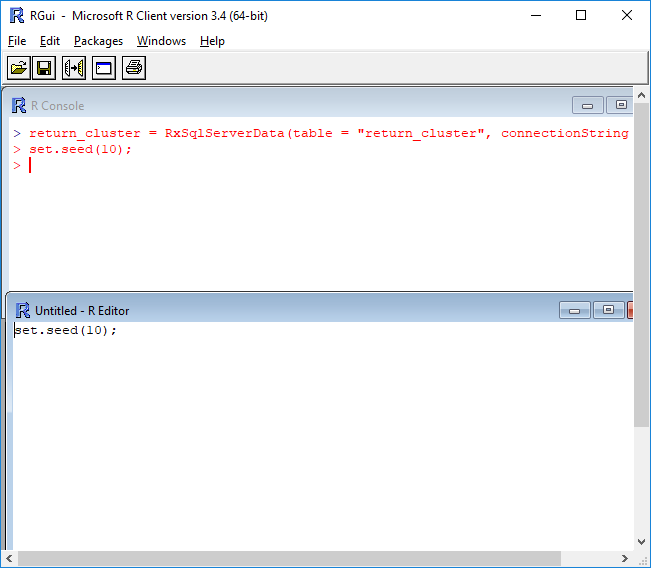
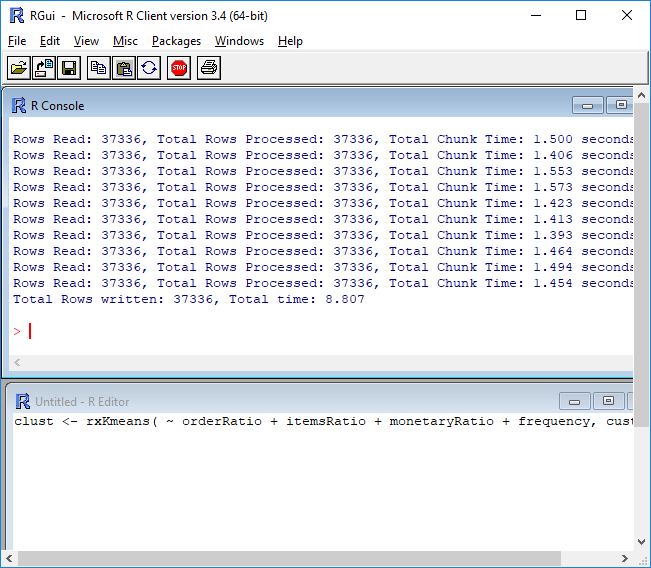
Generate clusters using rxKmeans and output key / cluster to a table in SQL
Server called return_cluster.
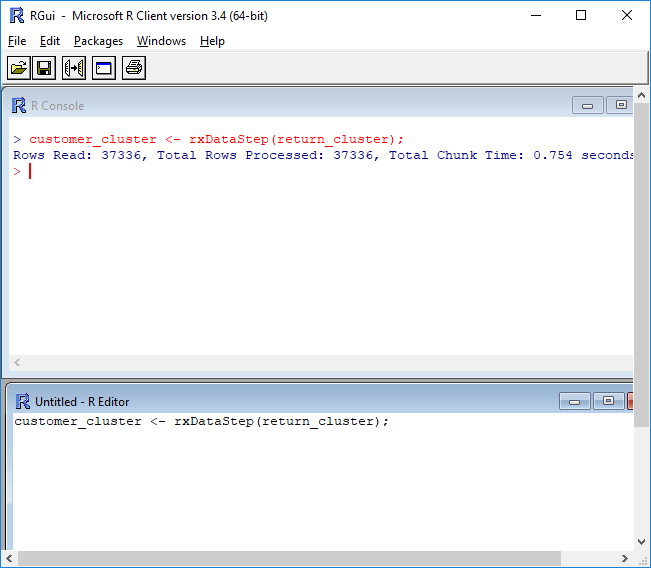
Read the customer returns cluster table from the database.
Using a plot to visualize data for analysis.
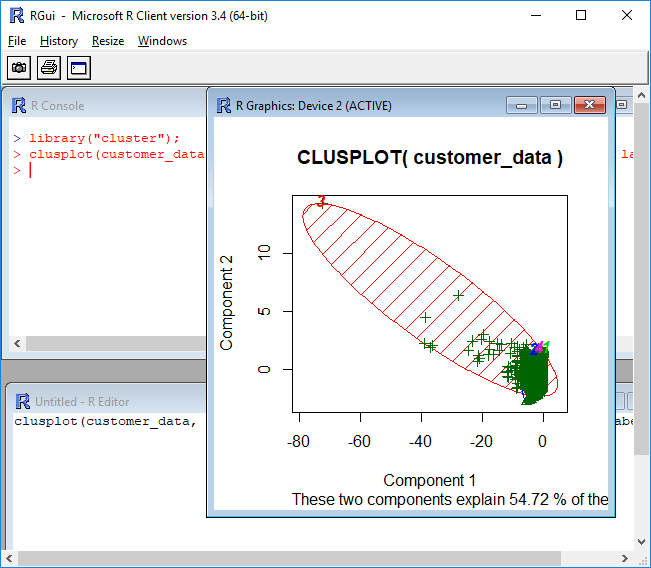
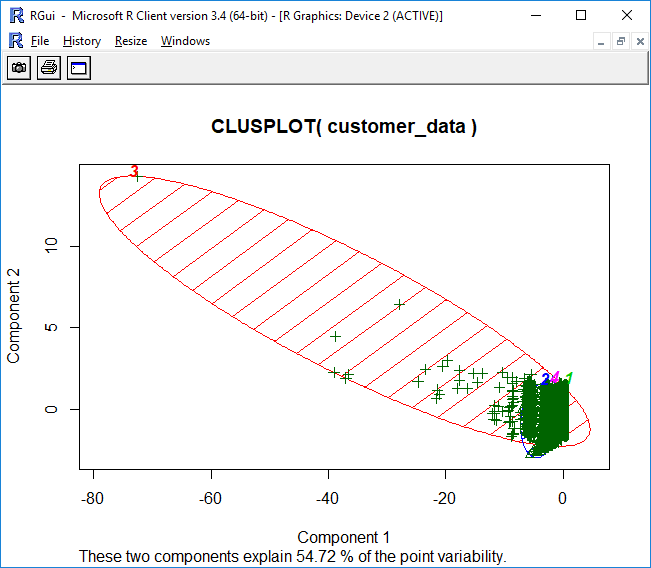
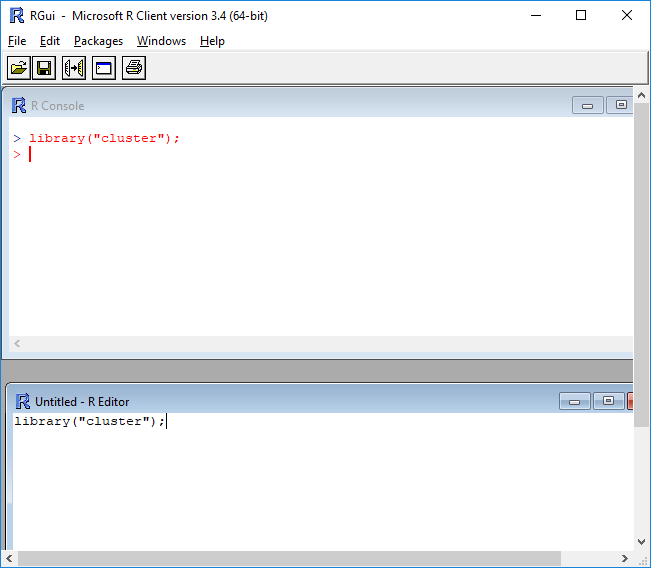
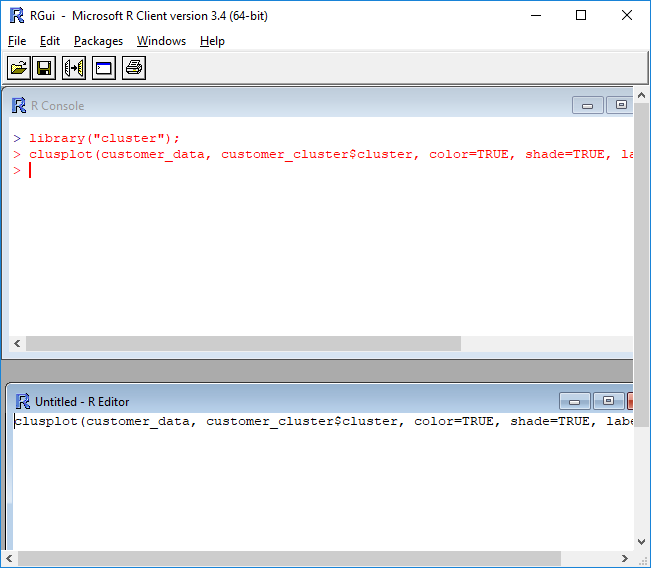
Below the statement that created the plot.
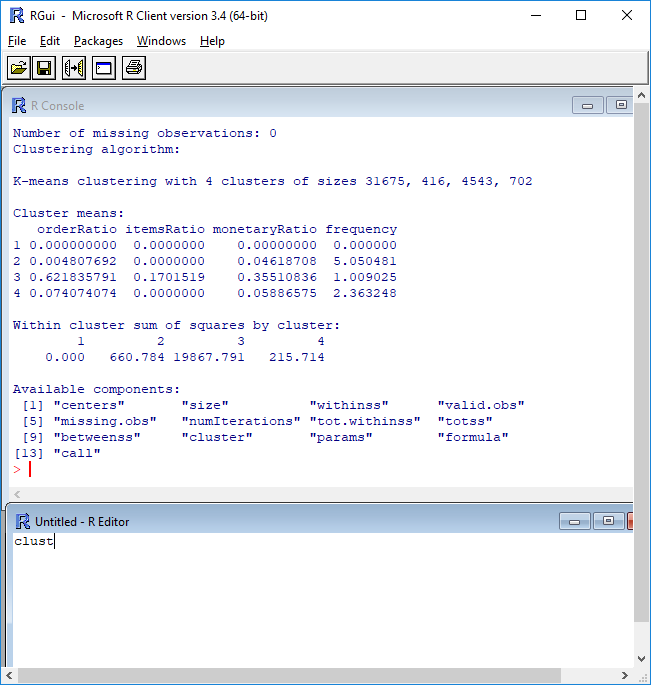
Analyzing cluster means.
The clust object contains the results from our Kmeans clustering. Look at the
clustering details and analyze results.
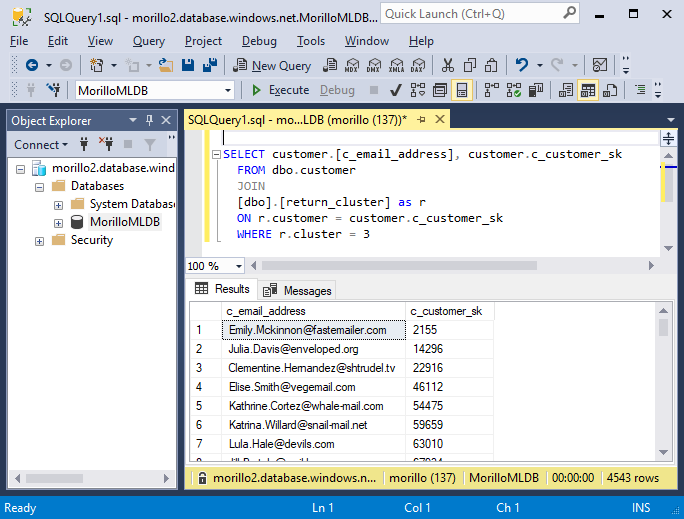
Now, let's use SQL Server Management Studio and the following SELECT statement
to use the cluster data to show email addresses of customers belonging to
cluster #3 from the tables in Azure SQL Database.
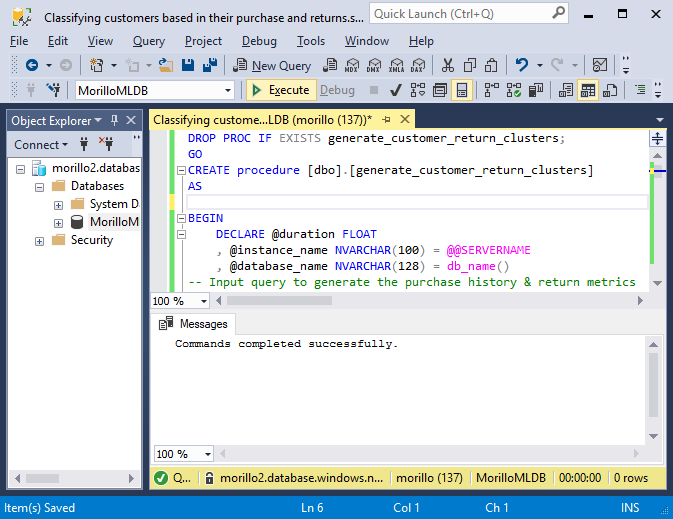
Creating a stored procedure with R code for clustering.
Putting R code on stored procedures makes it easy to run R code from
applications. The following script creates a stored procedure that will perform
clustering using R code.
DROP PROC IF EXISTS generate_customer_return_clusters;
GO
CREATE procedure [dbo].[generate_customer_return_clusters]
AS
/*
This procedure uses R to classify customers into different groups based on their
purchase & return history.
*/
BEGIN
DECLARE @duration FLOAT
, @instance_name NVARCHAR(100) = @@SERVERNAME
, @database_name NVARCHAR(128) = db_name()
, @input_query NVARCHAR(MAX) = N'
SELECT
ss_customer_sk AS customer,
round(CASE WHEN ((orders_count = 0) OR (returns_count IS NULL) OR (orders_count
IS NULL) OR ((returns_count / orders_count) IS NULL) ) THEN 0.0 ELSE (cast(returns_count
as nchar(10)) / orders_count) END, 7) AS orderRatio,
round(CASE WHEN ((orders_items = 0) OR(returns_items IS NULL) OR (orders_items
IS NULL) OR ((returns_items / orders_items) IS NULL) ) THEN 0.0 ELSE (cast(returns_items
as nchar(10)) / orders_items) END, 7) AS itemsRatio,
round(CASE WHEN ((orders_money = 0) OR (returns_money IS NULL) OR (orders_money
IS NULL) OR ((returns_money / orders_money) IS NULL) ) THEN 0.0 ELSE (cast(returns_money
as nchar(10)) / orders_money) END, 7) AS monetaryRatio,
round(CASE WHEN ( returns_count IS NULL ) THEN 0.0 ELSE returns_count END, 0) AS
frequency
FROM
(
SELECT
ss_customer_sk,
-- return order ratio
COUNT(distinct(ss_ticket_number)) AS orders_count,
-- return ss_item_sk ratio
COUNT(ss_item_sk) AS orders_items,
-- return monetary amount ratio
SUM( ss_net_paid ) AS orders_money
FROM store_sales s
GROUP BY ss_customer_sk
) orders
LEFT OUTER JOIN
(
SELECT
sr_customer_sk,
-- return order ratio
count(distinct(sr_ticket_number)) as returns_count,
-- return ss_item_sk ratio
COUNT(sr_item_sk) as returns_items,
-- return monetary amount ratio
SUM( sr_return_amt ) AS returns_money
FROM store_returns
GROUP BY sr_customer_sk
) returned ON ss_customer_sk=sr_customer_sk
'
EXEC sp_execute_external_script
@language = N'R'
, @script = N'
connStr <- paste("Driver=SQL Server;Server=", instance_name, " ;Database=",
database_name, " ;Trusted_Connection=true;", sep="" );
customer_returns <- RxSqlServerData(sqlQuery = input_query,
colClasses = c(customer = "numeric", orderRatio = "numeric", itemsRatio =
"numeric", monetaryRatio = "numeric", frequency = "numeric"),
connectionString = connStr);
return_cluster = RxSqlServerData(table = "customer_return_clusters",
connectionString = connStr);
set.seed(10);
"customer_return_clusters".
clust <- rxKmeans( ~ orderRatio + itemsRatio + monetaryRatio + frequency,
customer_returns, numClusters = 4
, outFile = return_cluster, outColName = "cluster", writeModelVars = TRUE ,
extraVarsToWrite = c("customer"), overwrite = TRUE);
'
, @input_data_1 = N''
, @params = N'@instance_name nvarchar(100), @database_name nvarchar(128), @input_query
nvarchar(max), @duration float OUTPUT'
, @instance_name = @instance_name
, @database_name = @database_name
, @input_query = @input_query
, @duration = @duration OUTPUT;
END;
GO
Let's now execute the stored procedure to perform the clustering.
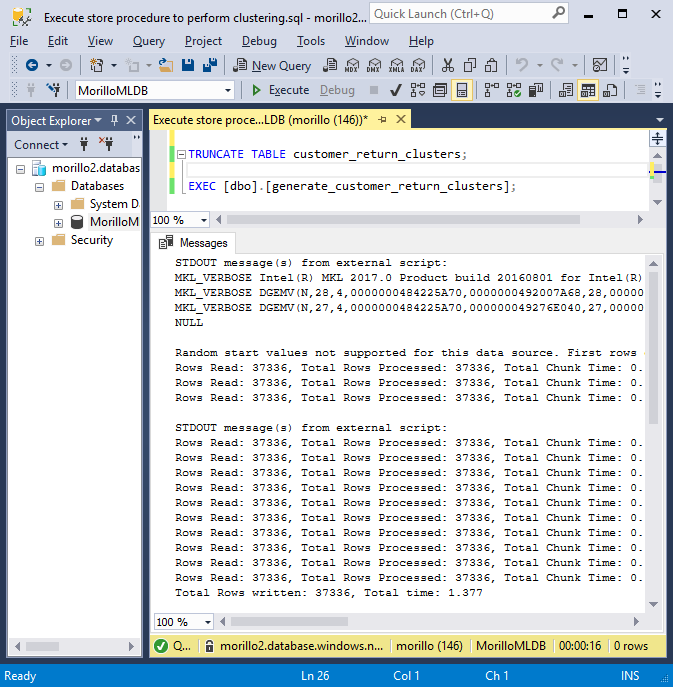
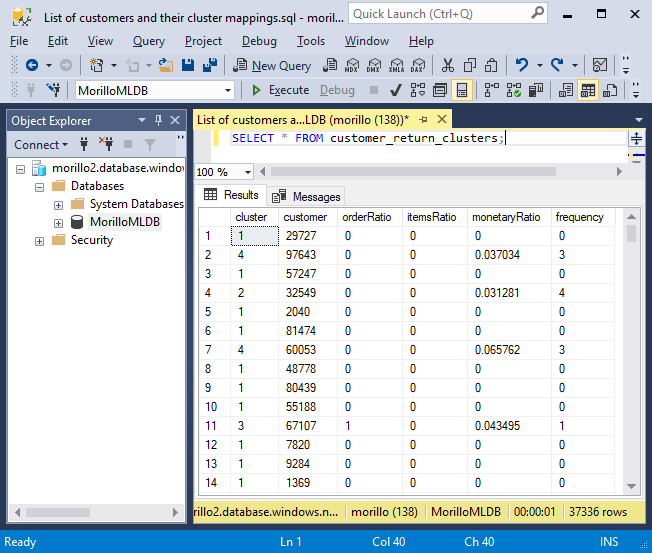
The following query verifies customers have been grouped and have assigned a
cluster number.
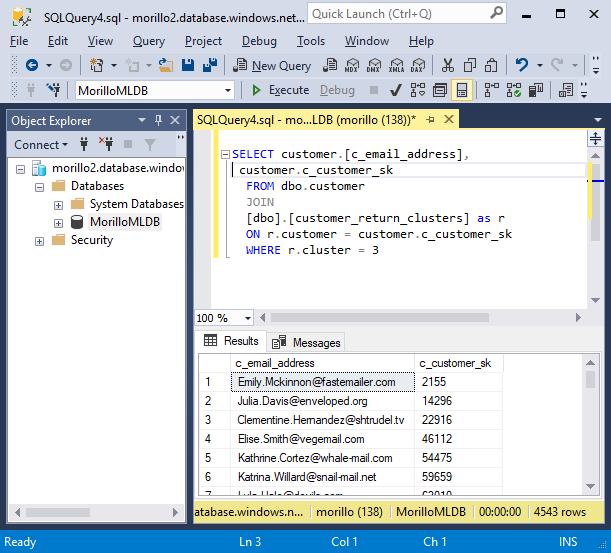
Let's run again the following SELECT statement to use the cluster data and show
email addresses of customers belonging to cluster #3 from the tables in Azure
SQL Database.
![[Company Logo Image]](images/SQLCofee.jpg)