SQL Server Resource Group Failed.
Applies to: Microsoft SQL Server 2005 Enterprise Edition, Windows Server 2003
Enterprise Edition.
Error Message.
The SQL Server resource group was down in a SQL Server 2005 cluster environment.
After we brought the SQL Server group online using Cluster Administrator, we
found that the following events were logged in the Event Viewer logs on the
active node at the time the failure occurred.
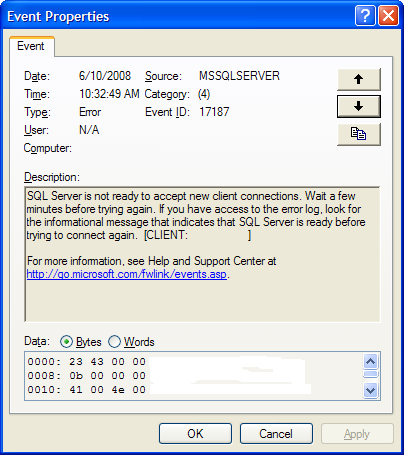
Event Type: Error
Event Source: MSSQLSERVER
Event Category: (4)
Event ID: 17187
Date: 6/10/2008
Time: 10:32:49 AM
User: N/A
Computer: SQLCLUSTER
Description:
SQL Server is not ready to accept new client connections. Wait a few minutes
before trying again. If you have access to the error log, look for the
informational message that indicates that SQL Server is ready before trying to
connect again [CLIENT: <ip
address>].

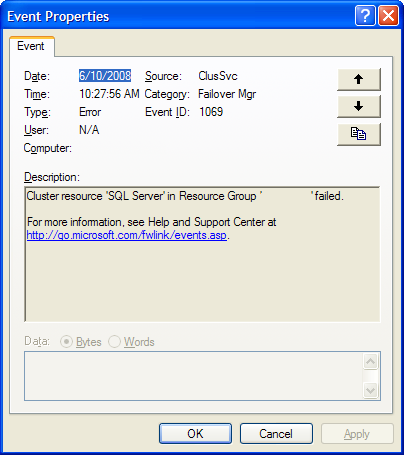
Event Type: Error
Event Source: ClusSvc
Event Category: (4)
Event ID: 1069
Date: 6/10/2008
Time: 10:27:56 AM
User: N/A
Computer: NODE1
Description:
Cluster resource 'SQL Server' in Resource Group 'Resource_group_name' failed.

Meanwhile, on the SQL Server log the following error was recorded.
Date 6/10/2008 10:28:46 AM
Log SQL Server (Archive #1 - 6/10/2008 10:29:00 AM)
Source Server
Message
All schedulers on Node 0 appear deadlocked due to a large number of worker
threads waiting on TRACEWRITE. Process Utilization 0%.
Problem Description.
These errors came right after a trace was started on the SQL Server Cluster
from a remote machine using SQL Server Profiler. The first error was recorded on
the SQL Server log showing that all schedulers on the active node were
deadlocked.
Seems to be the failure was induced by the trace.
Solution.
Bring the SQL Server group online.
1. Open Cluster Administrator
2. Expand Groups
3. Select only the SQL Group
4. Make a right click on it, and select "Bring Online"
Also, the following recommendations should be considered when using SQL
Profiler, since the problem was induced by a SQL Profiler trace:
1. If you are using SQL Profiler with the "Server processes SQL Server trace
data" option checked, try not to use it for a long period of time.
2. Monitor only the events that have some meaning for you.
3. If you are using the "Save to file:" option, try to keep under control the
size of the trace files. Trace files that grow too quickly will have
impact on performance.
4. It's better to avoid using the "Save to table:" option, because it could have
performance implications on a busy server. Please, capture event data to a
local file, then load the trace data into a table for analysis.
5. Try not to run SQL profiler on a busy server
![[Company Logo Image]](images/SQLCofee.jpg)
